Match and team analysis staff can act on
Pre-match, post-match and season analysis that explains how a team plays and where games are won and lost, delivered before the next match.
Deliverables
Opposition reports
Pre-match reports on build-up, pressing, chance creation and set pieces, with the patterns staff should prepare for.
Post-match reports
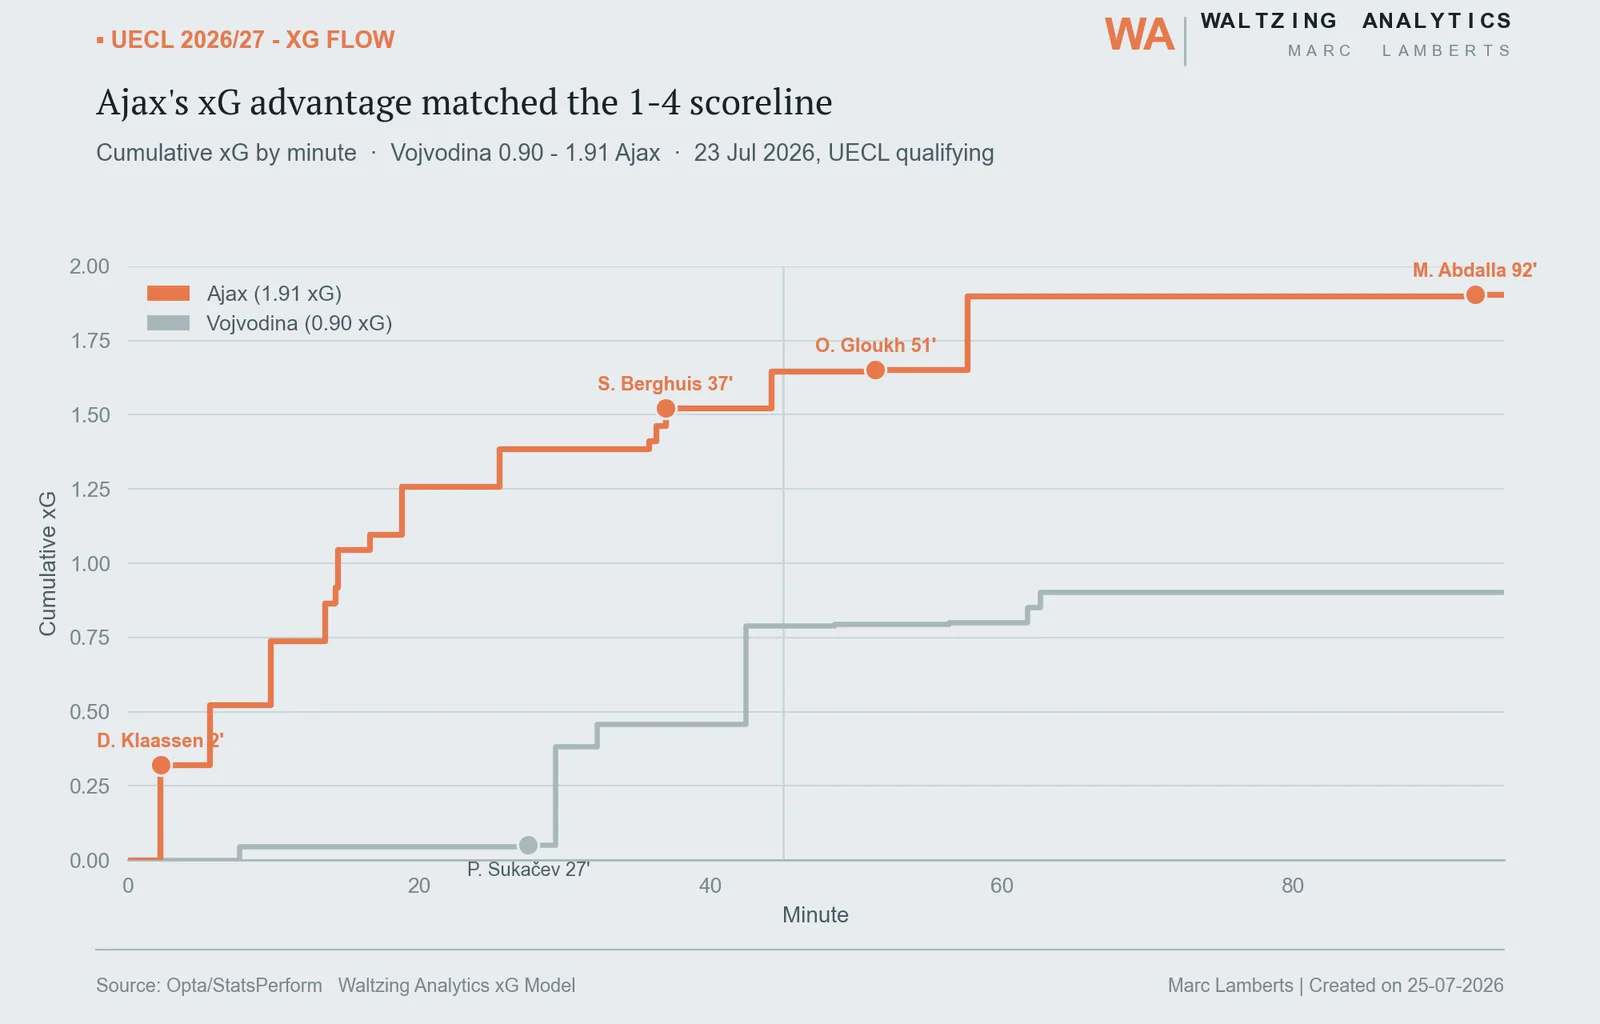
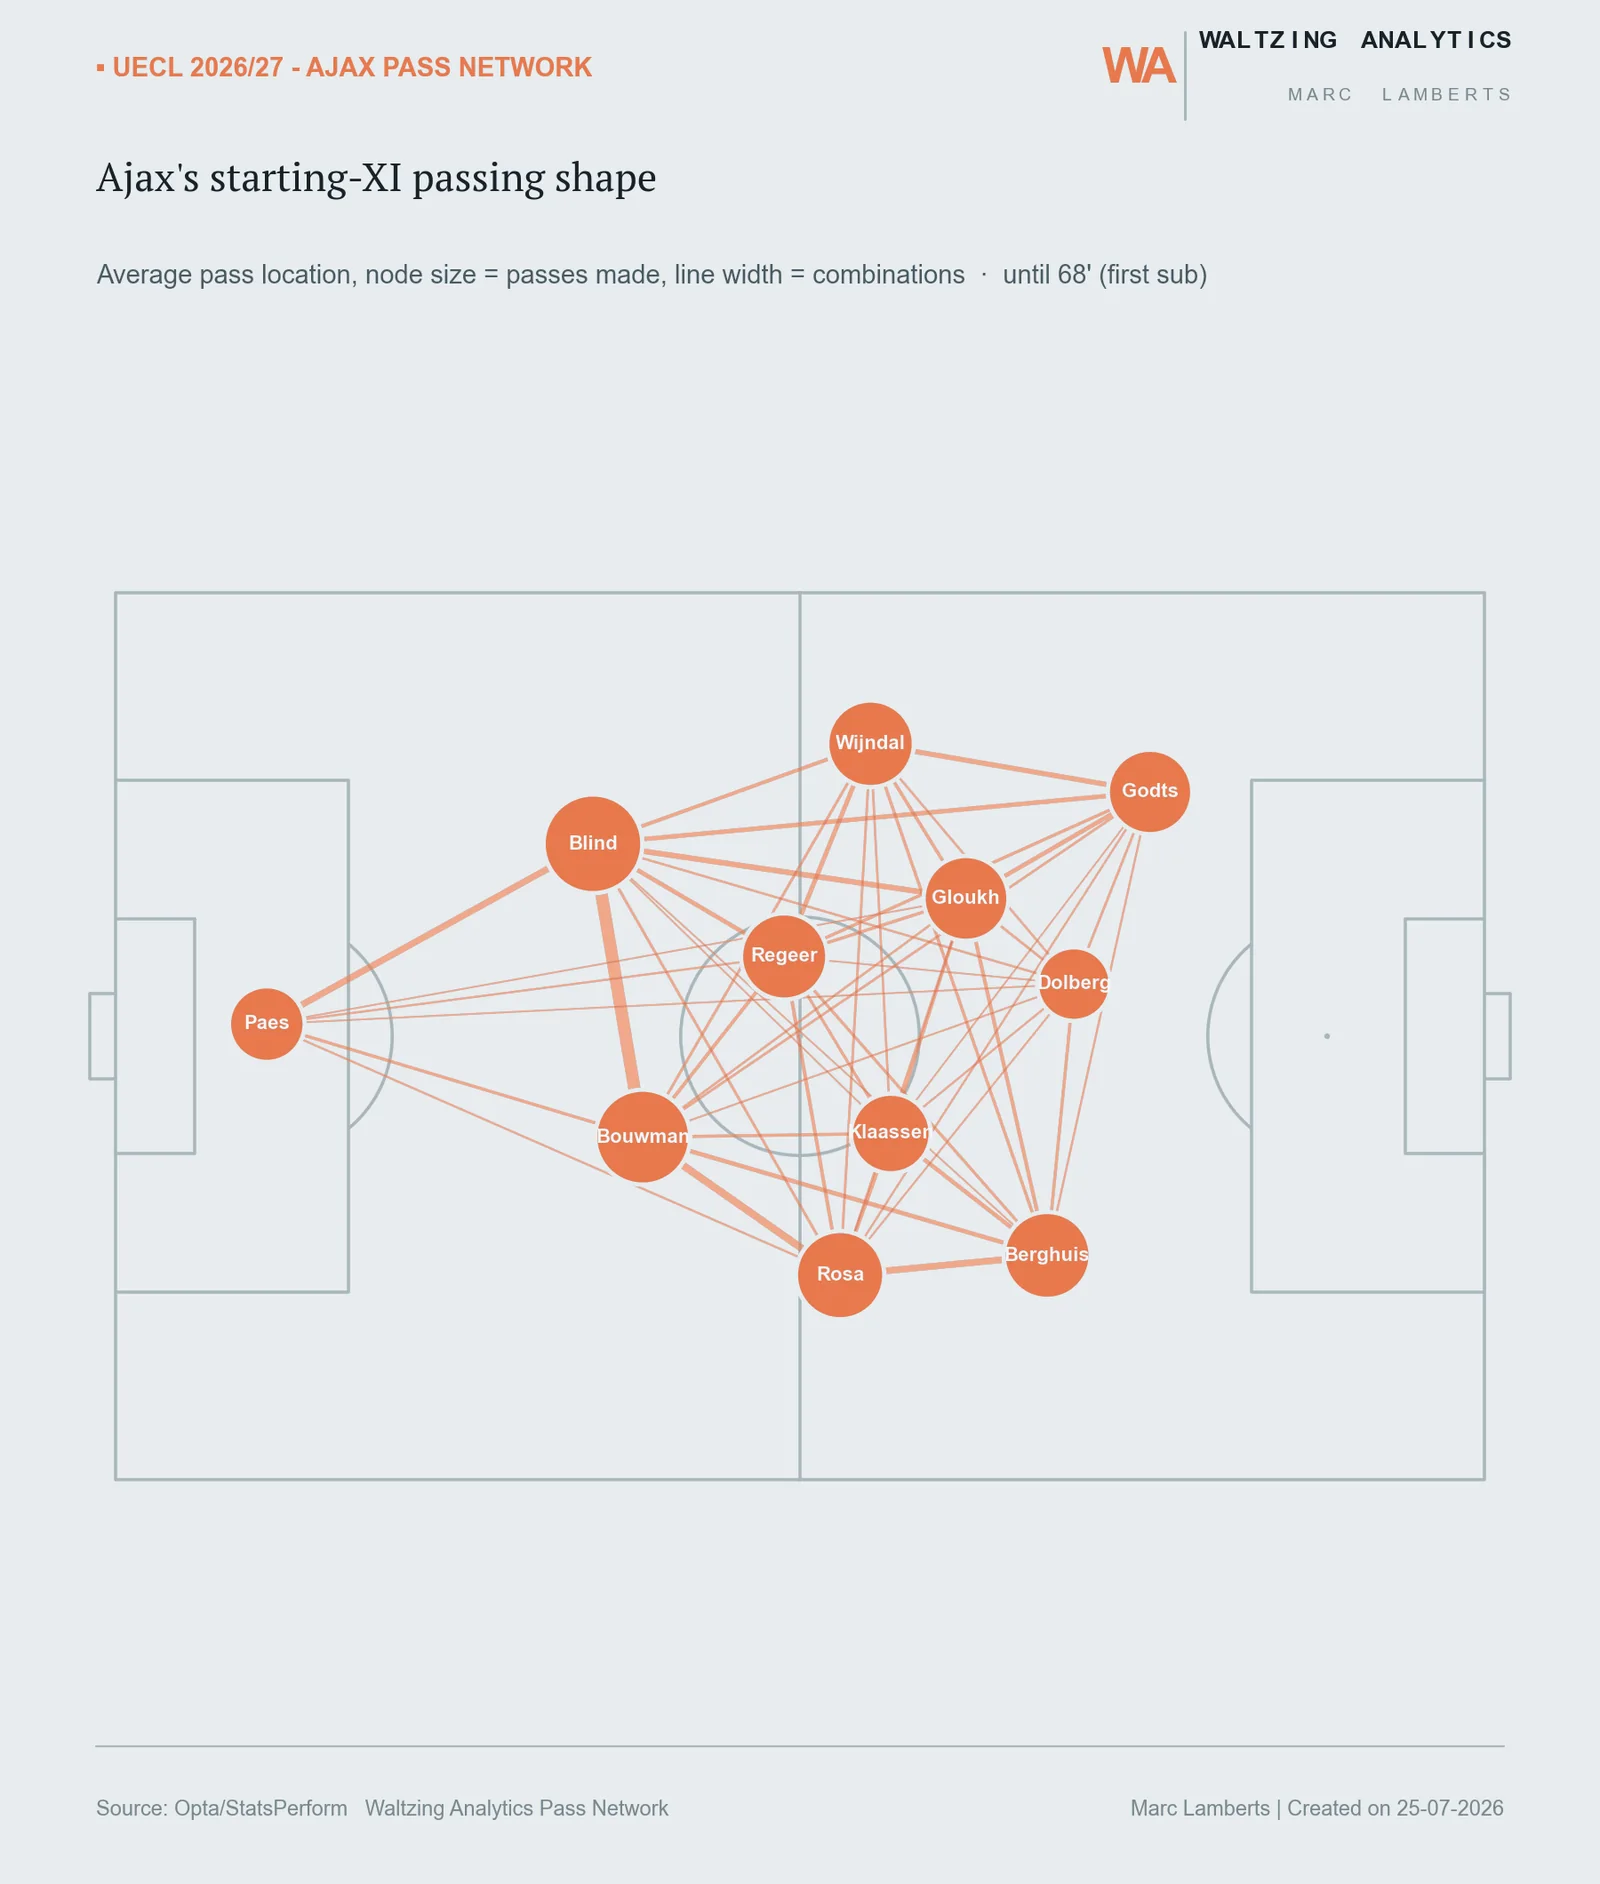
Full match breakdowns: shot maps, xG and threat flow, passing networks, pressing and transitions.
Season reviews
Season-long trends for your team against the league average, with every metric shown in context.
Team style models
Style maps and similarity models built from raw events, to benchmark your team against the league and track how it changes.
Pressing models
Expected Fails Forced (xFF) measures how likely a press is to force the player on the ball into a failed action.
Ball-progression models
Contextual Expected Threat (CxT) values every pass and carry with match context, not a fixed pitch grid.
From a single match to a full season
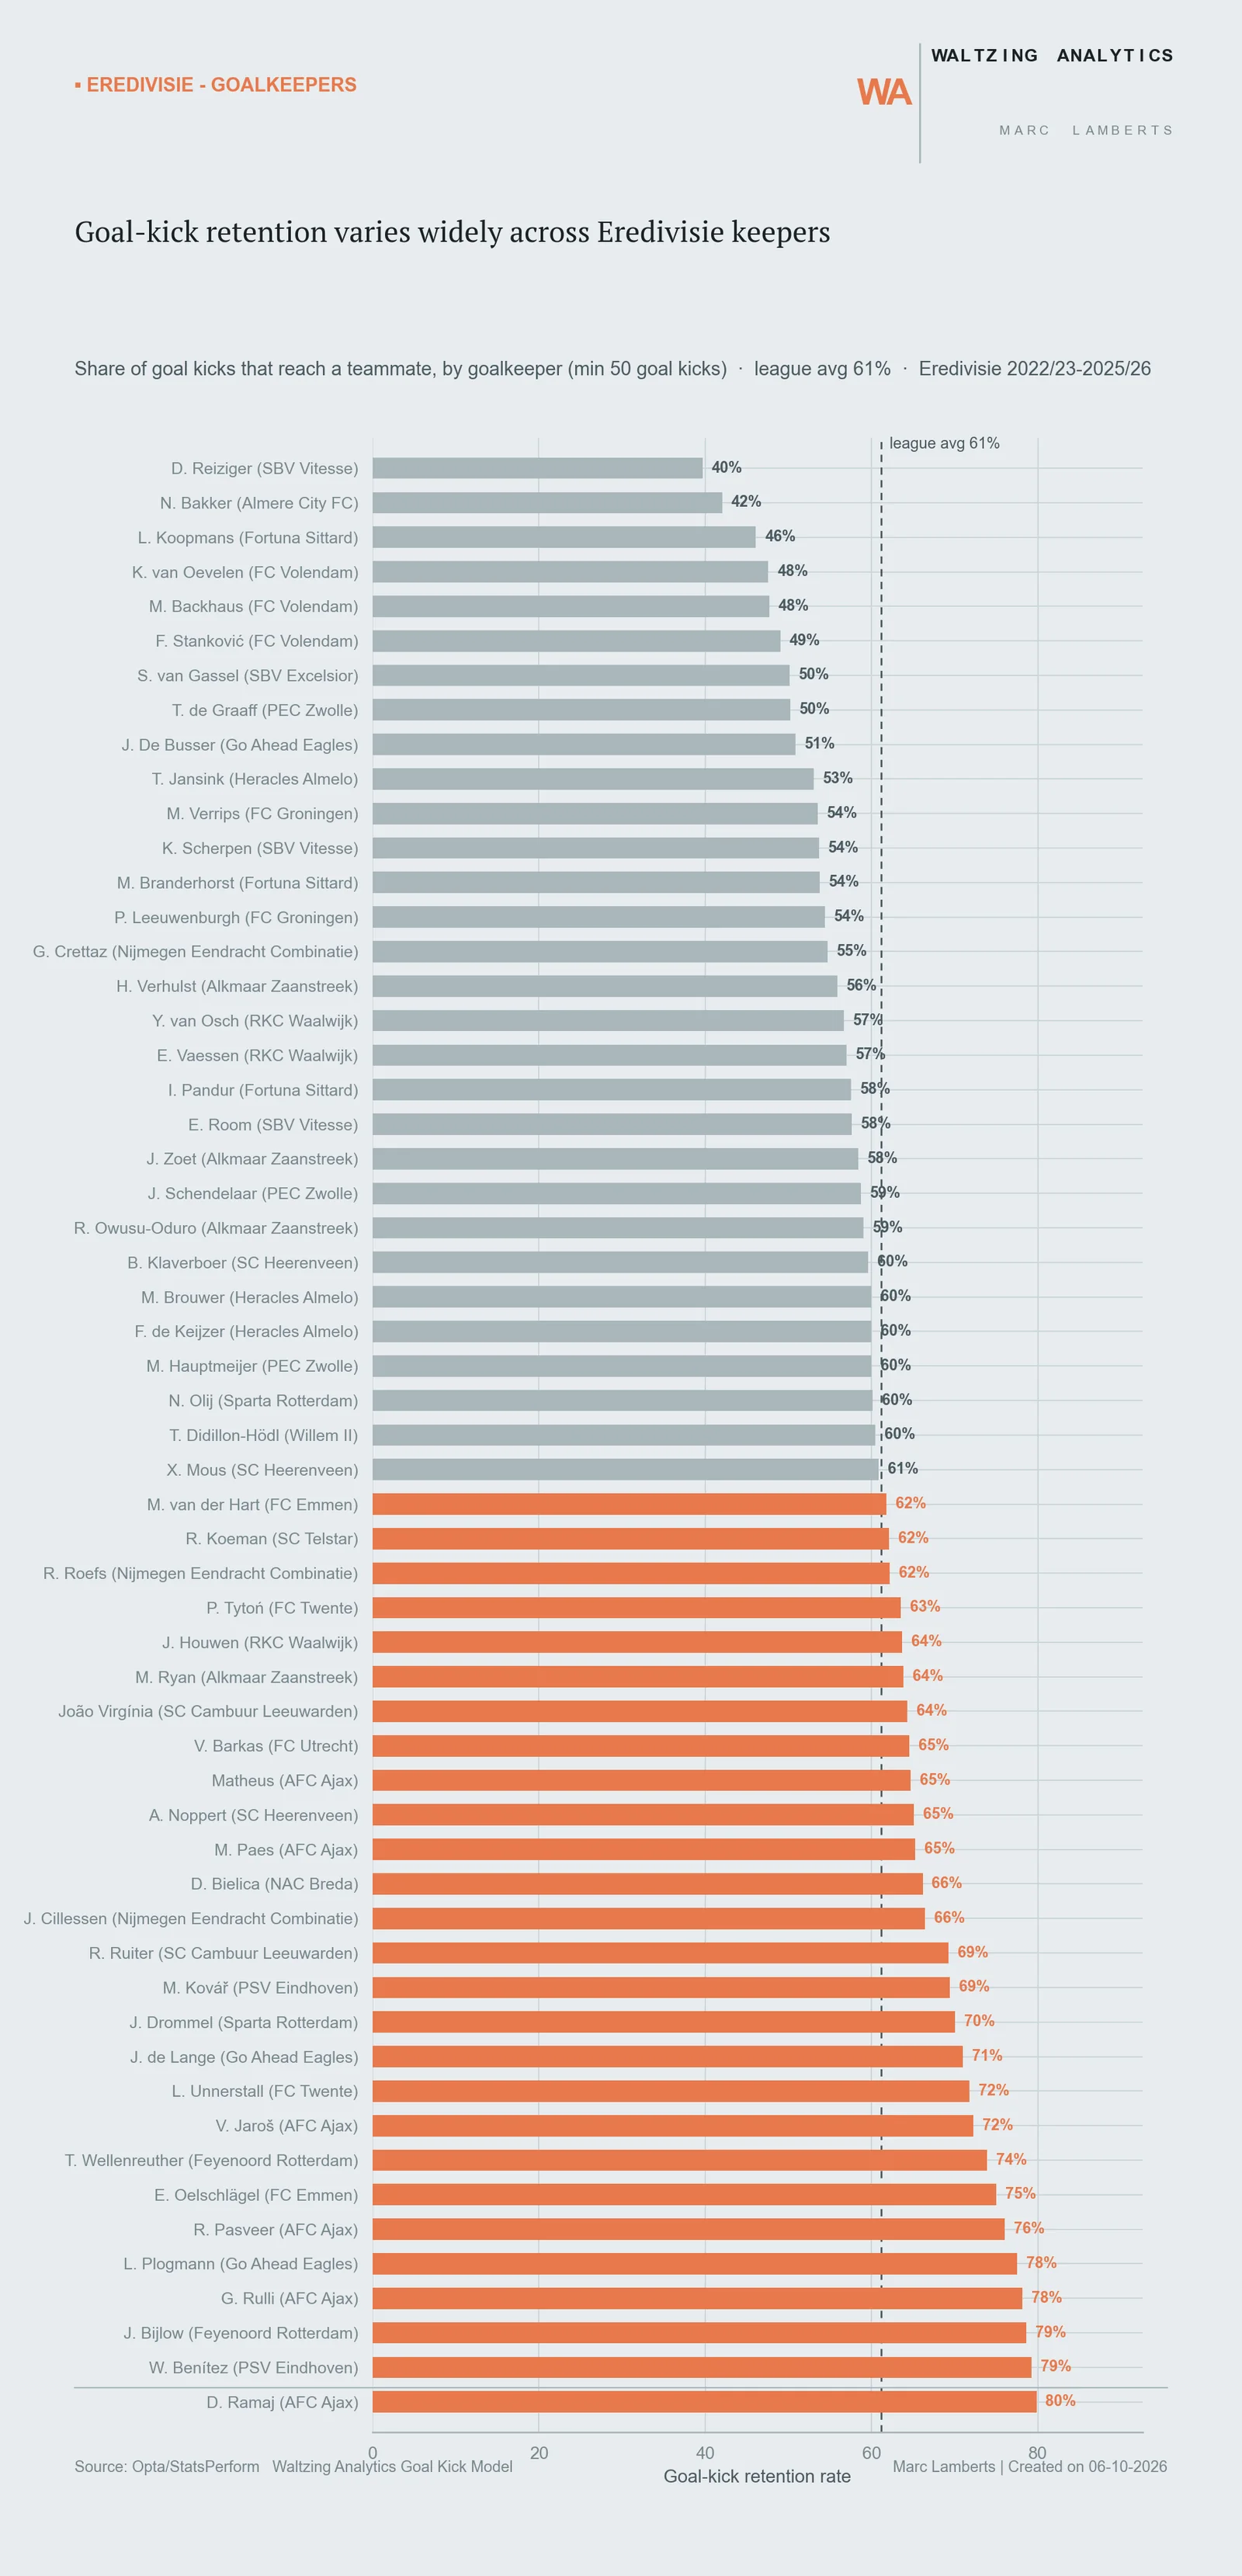
The same event data is analysed at two levels: season-long league patterns, and single-match breakdowns at the level of detail a post-match report needs.
Every report follows one house style: the finding as the headline, one accent colour and a source line on every page.
Built on
- Opta / Stats Perform
- StatsBomb incl. 360
- IMPECT
- Wyscout
Related work
Have a question your data should answer?
Tell me the decision you need to make, and I will propose the data and model to support it.