About Waltzing Analytics
I'm a football data professional working across the three disciplines that make analytics actually useful at a club: data analysis, data engineering, and scouting. Rather than treating those as separate jobs, I run them as one practice: the same event data that feeds a model also feeds the pipeline that automates it and the report that puts it in front of a coach or scout.
My work is built on Opta, StatsBomb, IMPECT and Wyscout event data plus SkillCorner tracking data: expected goals (xG) models trained with XGBoost and isotonic calibration, set-piece and buildup analysis, player role clustering, and pre- and post-match scouting reports. Everything is delivered in a consistent visual house style, so a report from week 1 and a report from week 30 read as part of the same body of work.
If you're a club, agency, or analyst who needs data turned into something a coach can act on before the next match, that's the gap I work in.
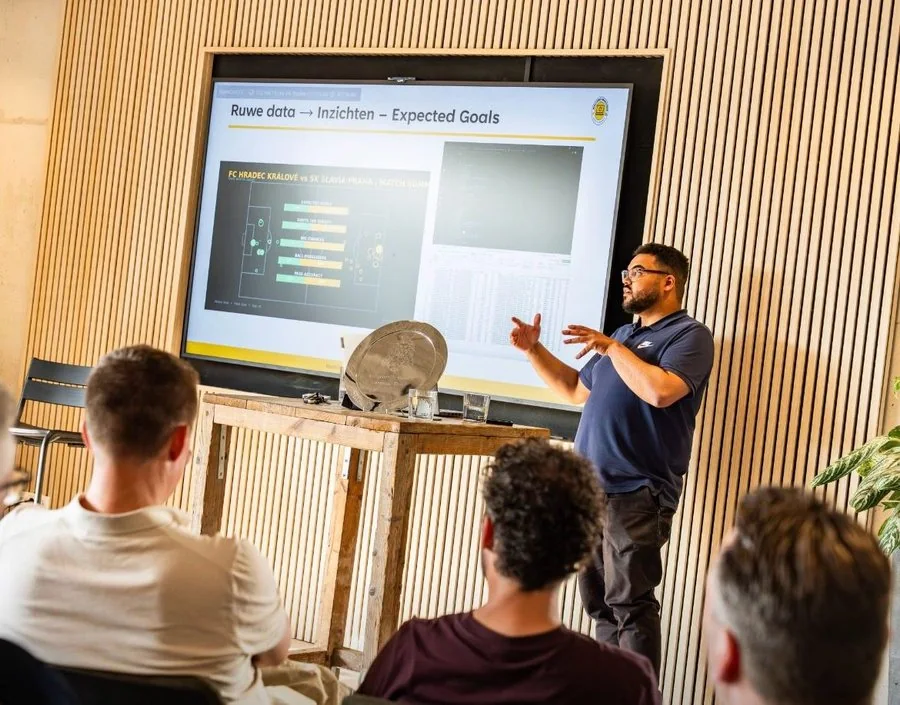
How I work
Data doesn't tell you what happened; it tells you what got recorded, from one particular way of watching a match. I've spent over a decade looking at spreadsheets for football scouting and analysis, and the biggest shift in how I work wasn't a new model or a new dataset, it was realising that every number carries a point of view. An xG value is a judgement, not a fact. A pass completion rate hides who took the risk and who didn't. Treating data as evidence to argue with, rather than a verdict to accept, is the starting point for everything else here.
That's why uncertainty isn't an afterthought; it's built into the output. A player who put up a strong score across five matches means something different from the same score over twenty-five, and a report that hides that difference isn't doing its job. Wherever it's useful, a finding comes paired with a sense of how much to trust it: how much data it rests on, how stable the pattern actually is, and where the signal could just be noise.
In practice that means building things properly rather than quickly: pipelines that turn raw Opta, StatsBomb and IMPECT event data into the same clean structure every time, models that are calibrated and checked rather than just plausible-looking, and reports that lead with what changed and why. Most of the findings worth publishing started out as bugs I didn't trust. The discipline is in checking a result twice before believing it, not in how fast it can be produced.
The process
Every project still follows the same four steps, whether it's a one-off analysis or a season-long engagement:
- Ingest: Opta, StatsBomb and IMPECT event data and SkillCorner tracking data are parsed and validated into a consistent match and season structure.
- Model: features are engineered and scored (xG, set-piece value, player roles) with calibrated models, not rules of thumb.
- Report: findings are written up in a consistent house style: one accent color, a finding as the headline, a source line on every page.
- Decide: reports and dashboards land with coaches, scouts or analysts in time to inform an actual decision.
Built with Python, Opta/StatsPerform, StatsBomb, IMPECT and SkillCorner data, XGBoost, pandas, matplotlib, and the Waltzing Analytics house style used across every report.