A worked example of the analysis behind the Data Analysis tile, at two levels: season-long league patterns and single-match breakdowns. Built on Opta/StatsPerform event data, styled in the same Waltzing Analytics house style used across every report.
Season-level: Eredivisie goal kicks
Every goal kick in the Eredivisie since 2022/23, broken down by where it lands, how often it's kept, and which goalkeepers are most reliable under a short buildup.
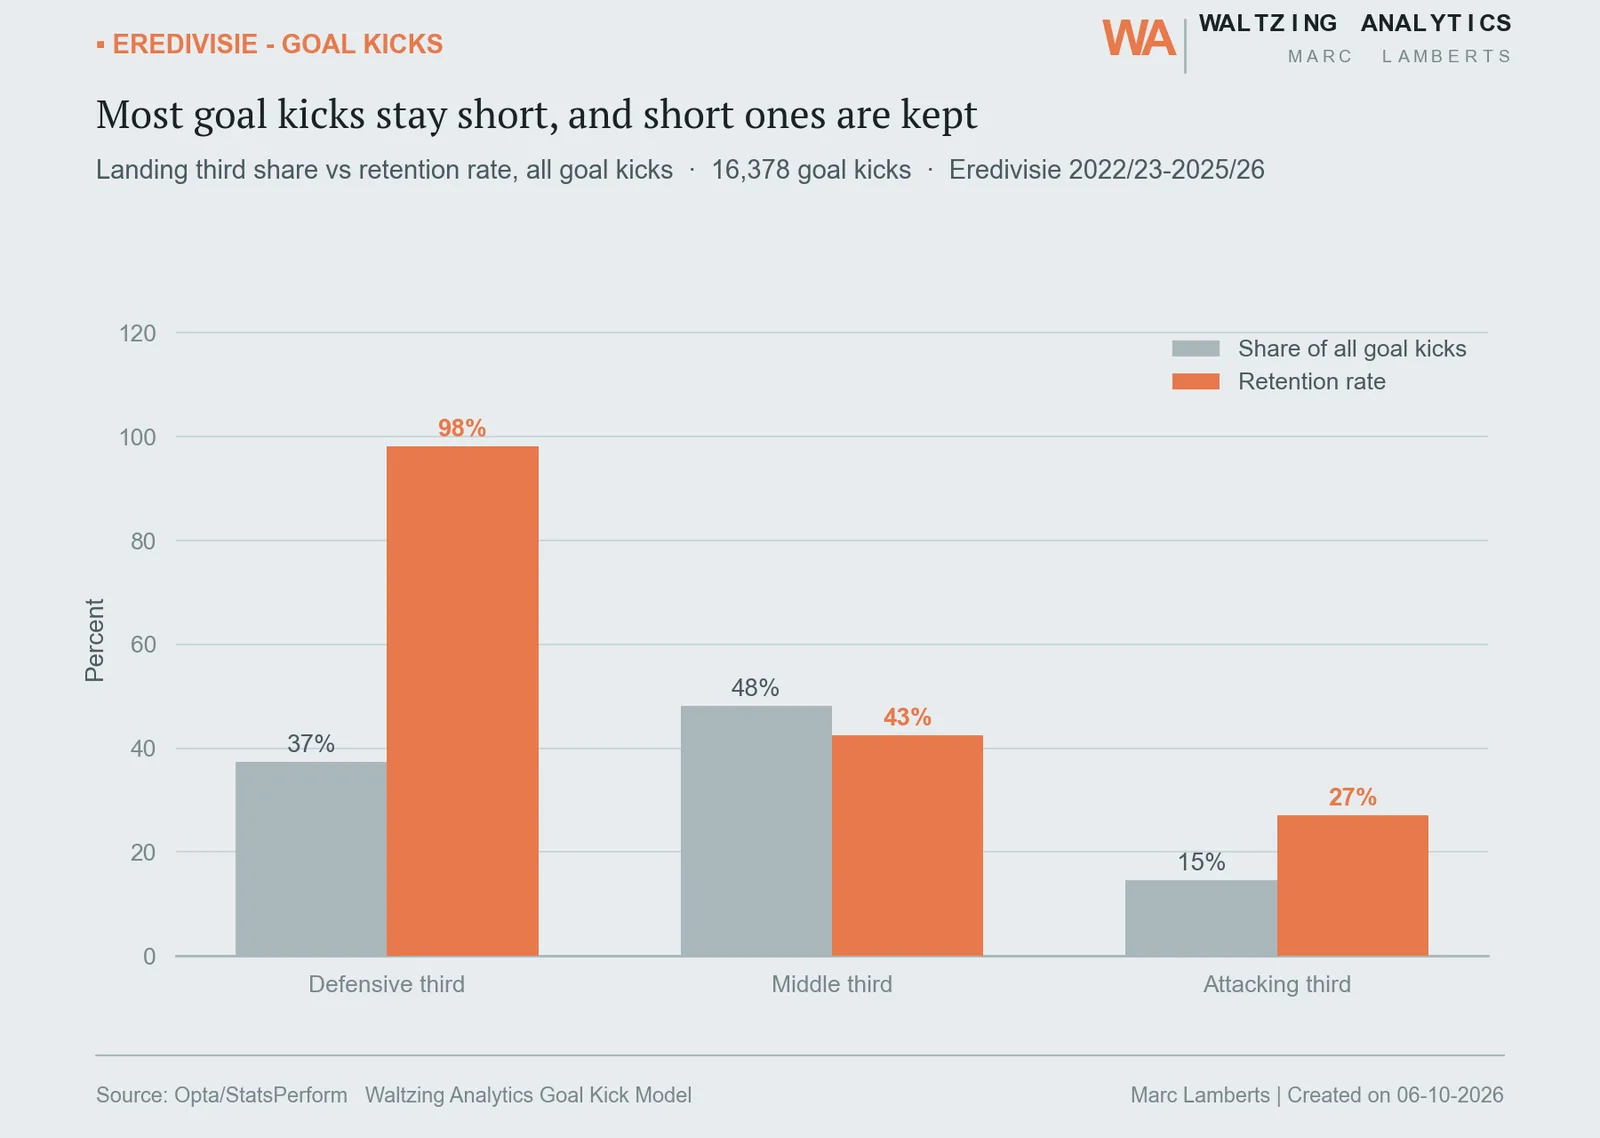
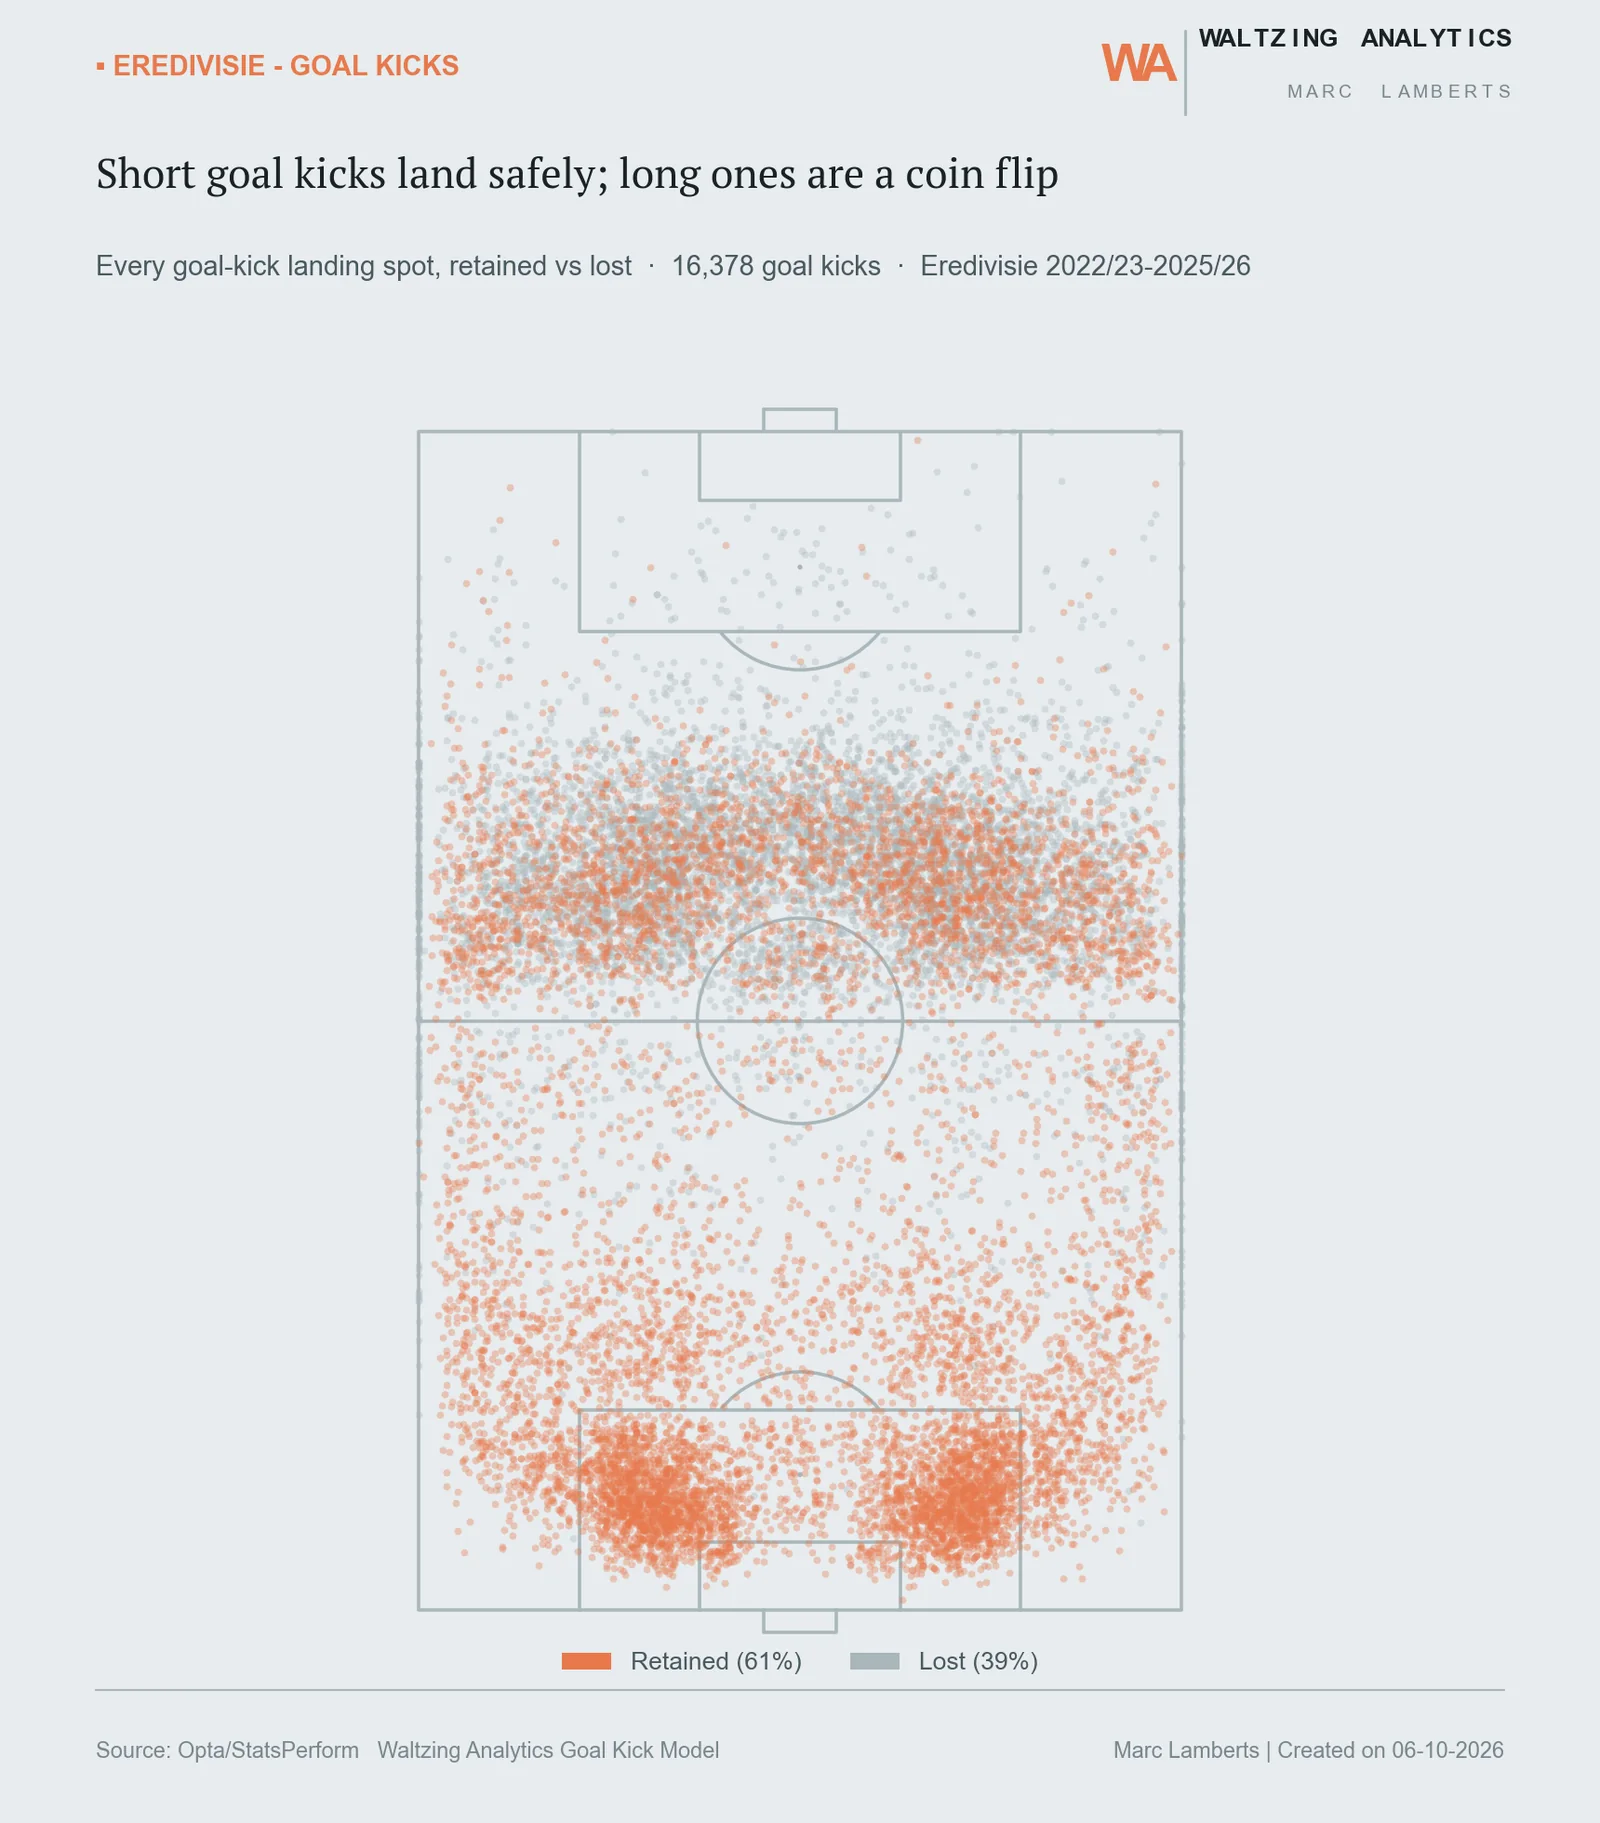
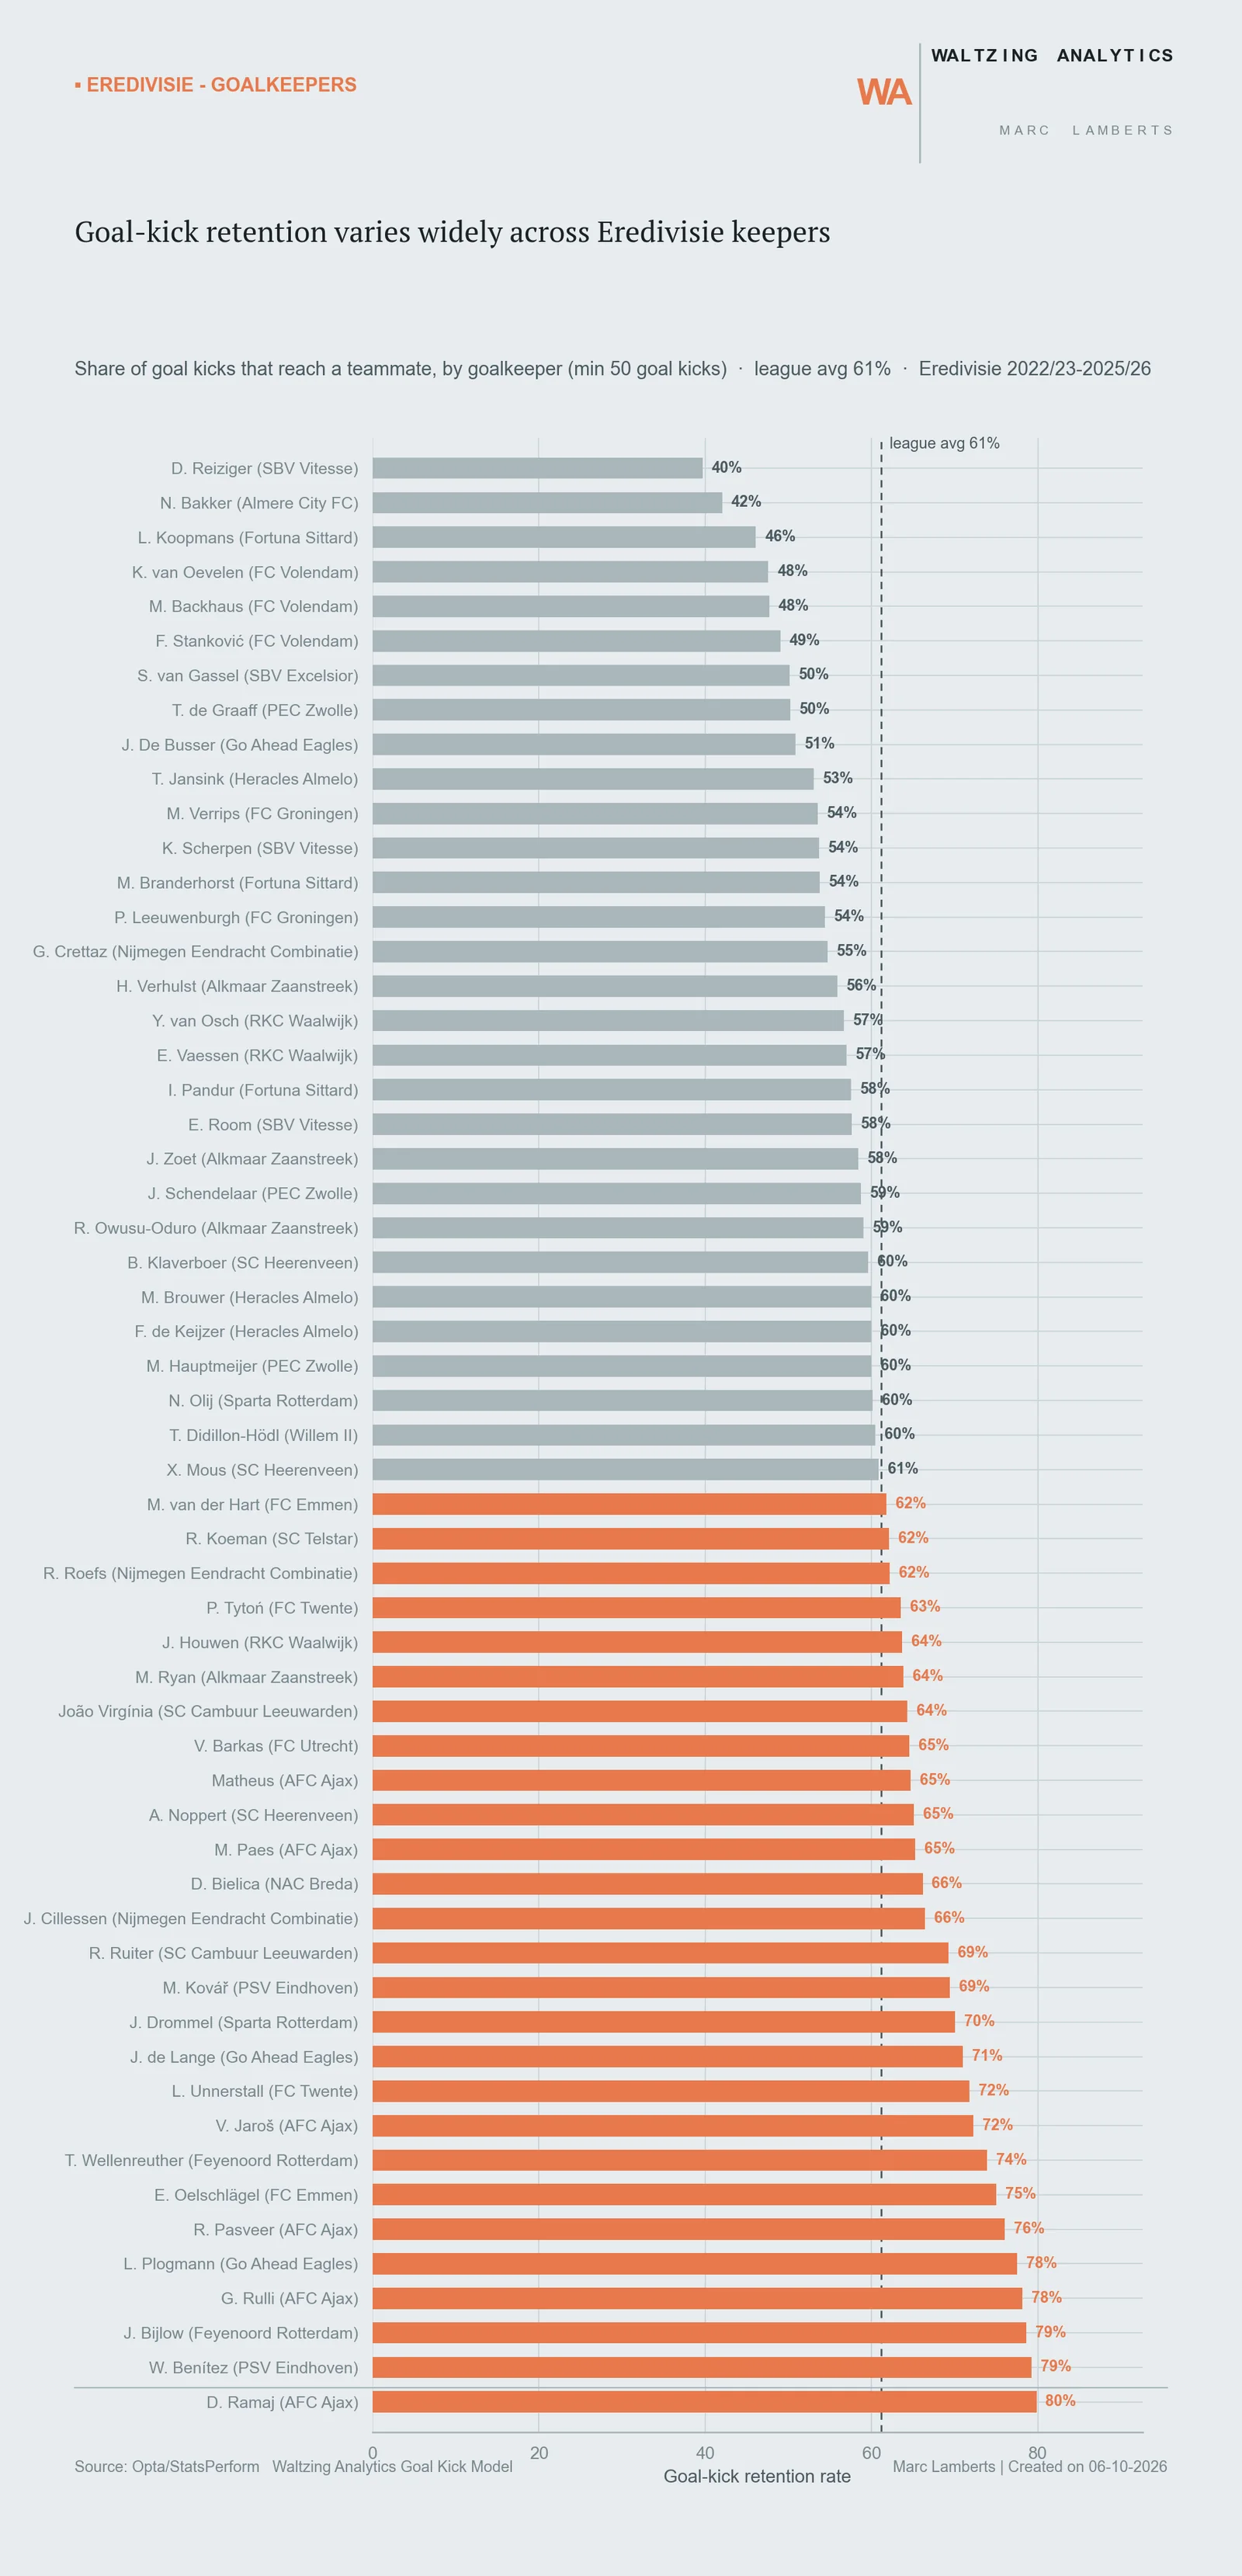
Most goal kicks stay short, and short ones are kept: landing-third share vs. retention rate across 16,378 Eredivisie goal kicks, 2022/23–2025/26.Short goal kicks land safely; long ones are a coin flip: every landing spot plotted, retained vs. lost.Goal-kick retention varies widely across Eredivisie keepers: every keeper with at least 50 goal kicks, ranked by share reaching a teammate.
The same event data broken down for a single match instead of a season: Vojvodina 1–4 Ajax, UECL qualifying, 23 Jul 2026. This is the level of detail a post-match report works from.
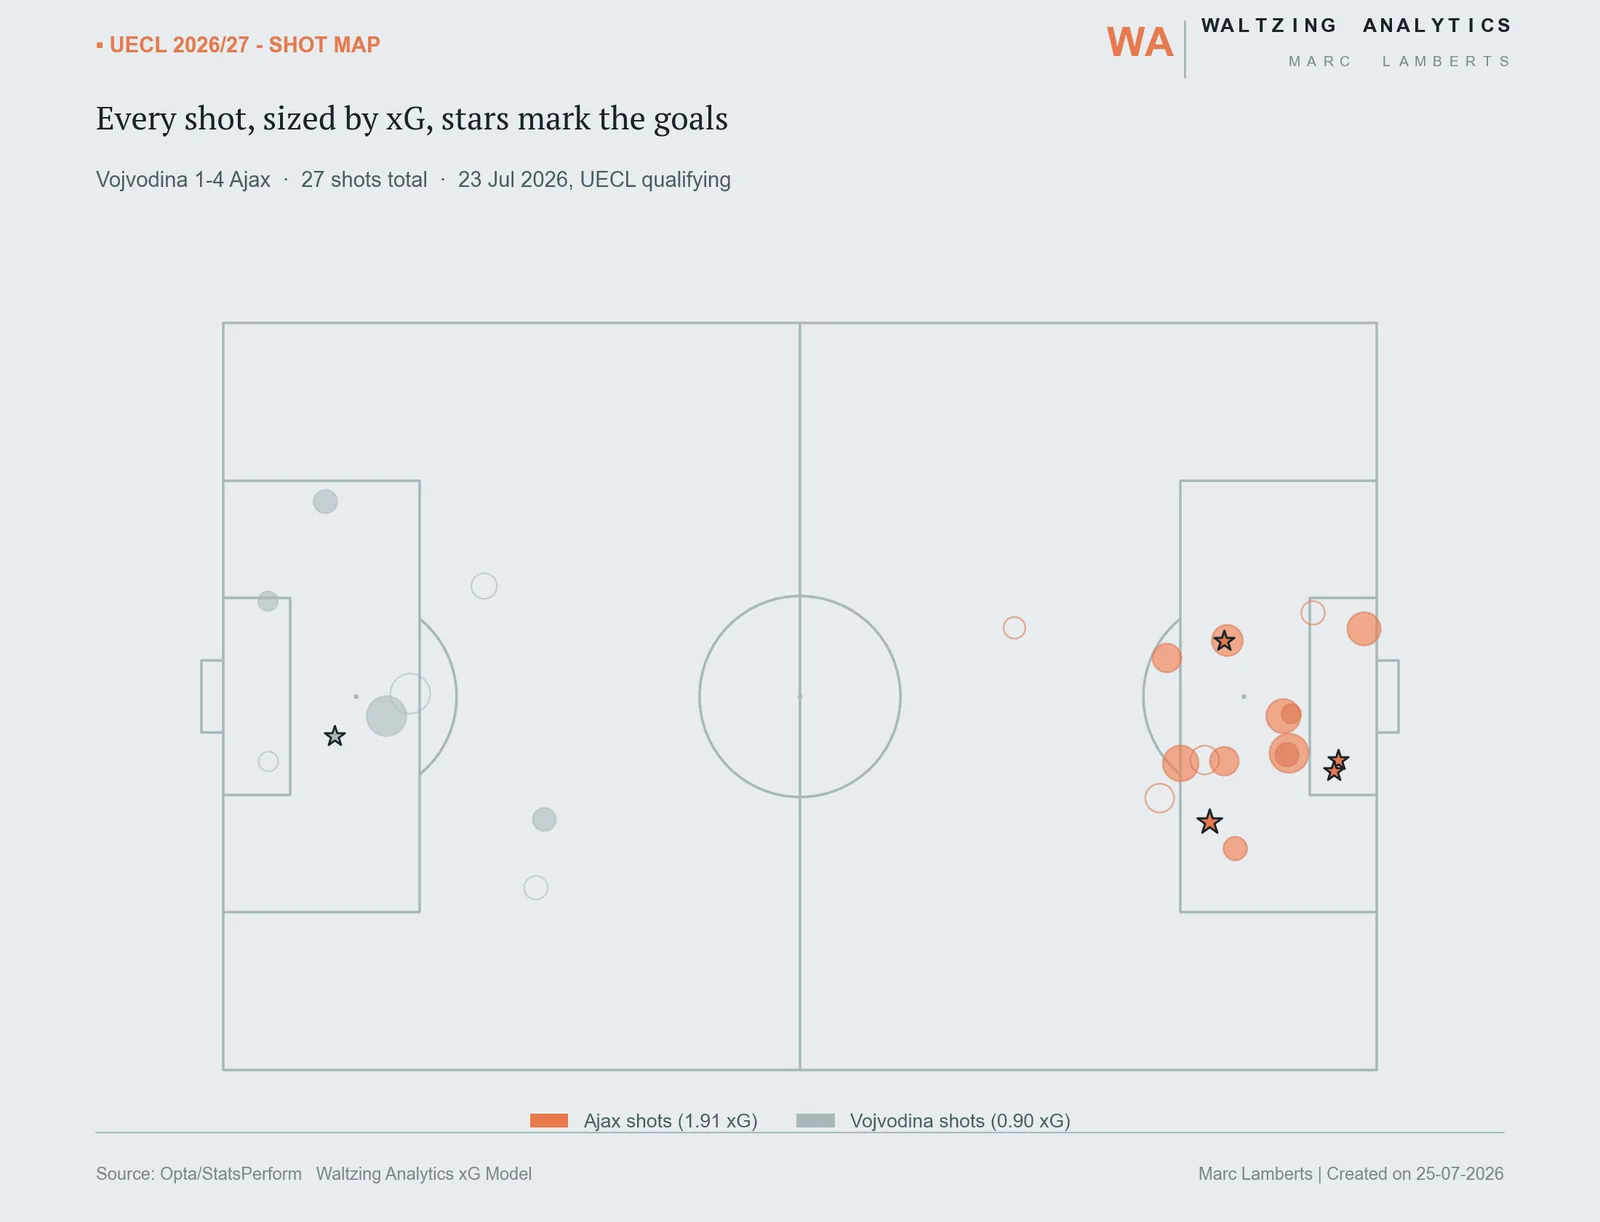
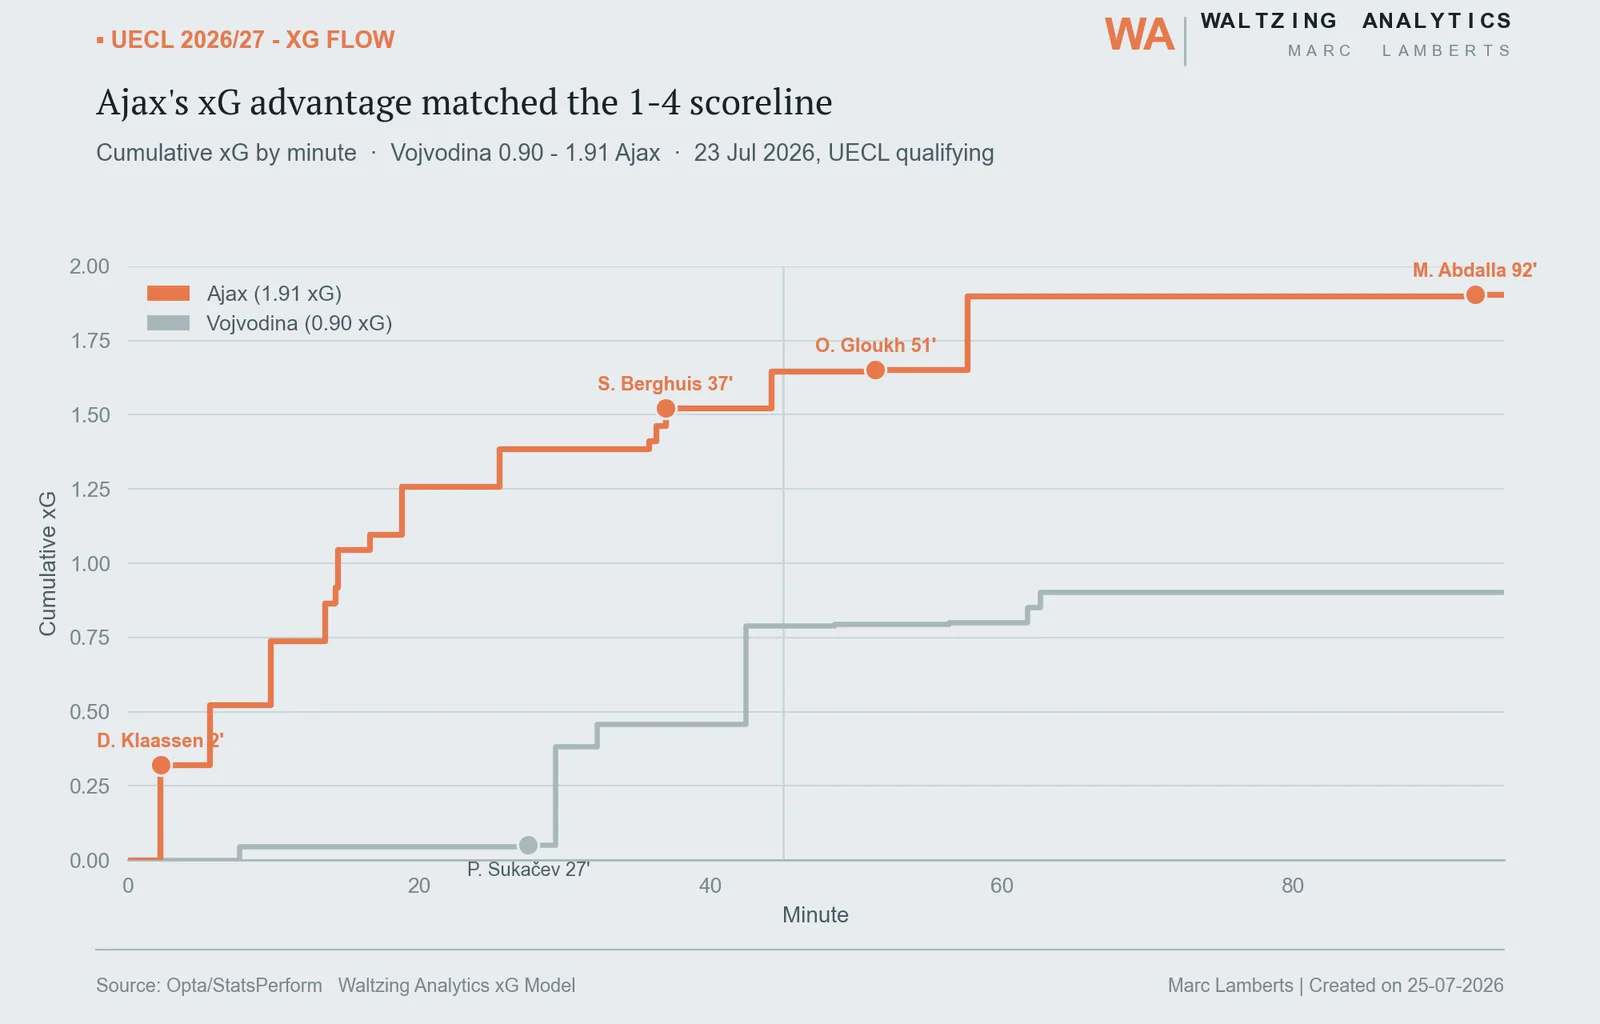
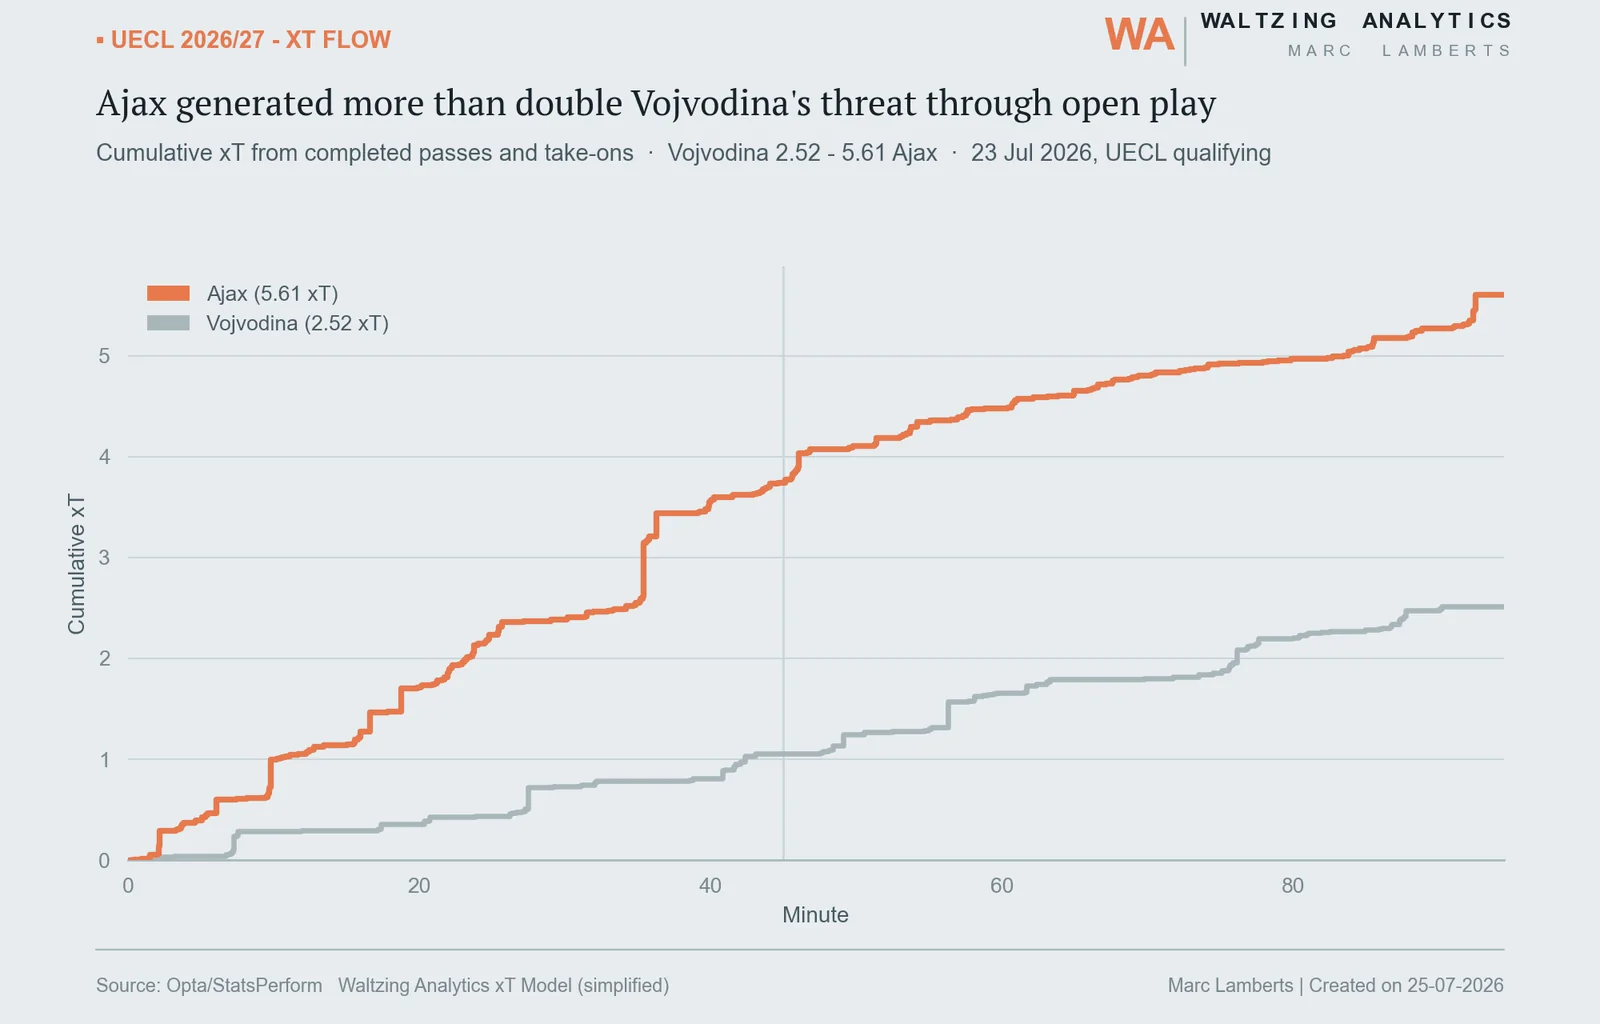
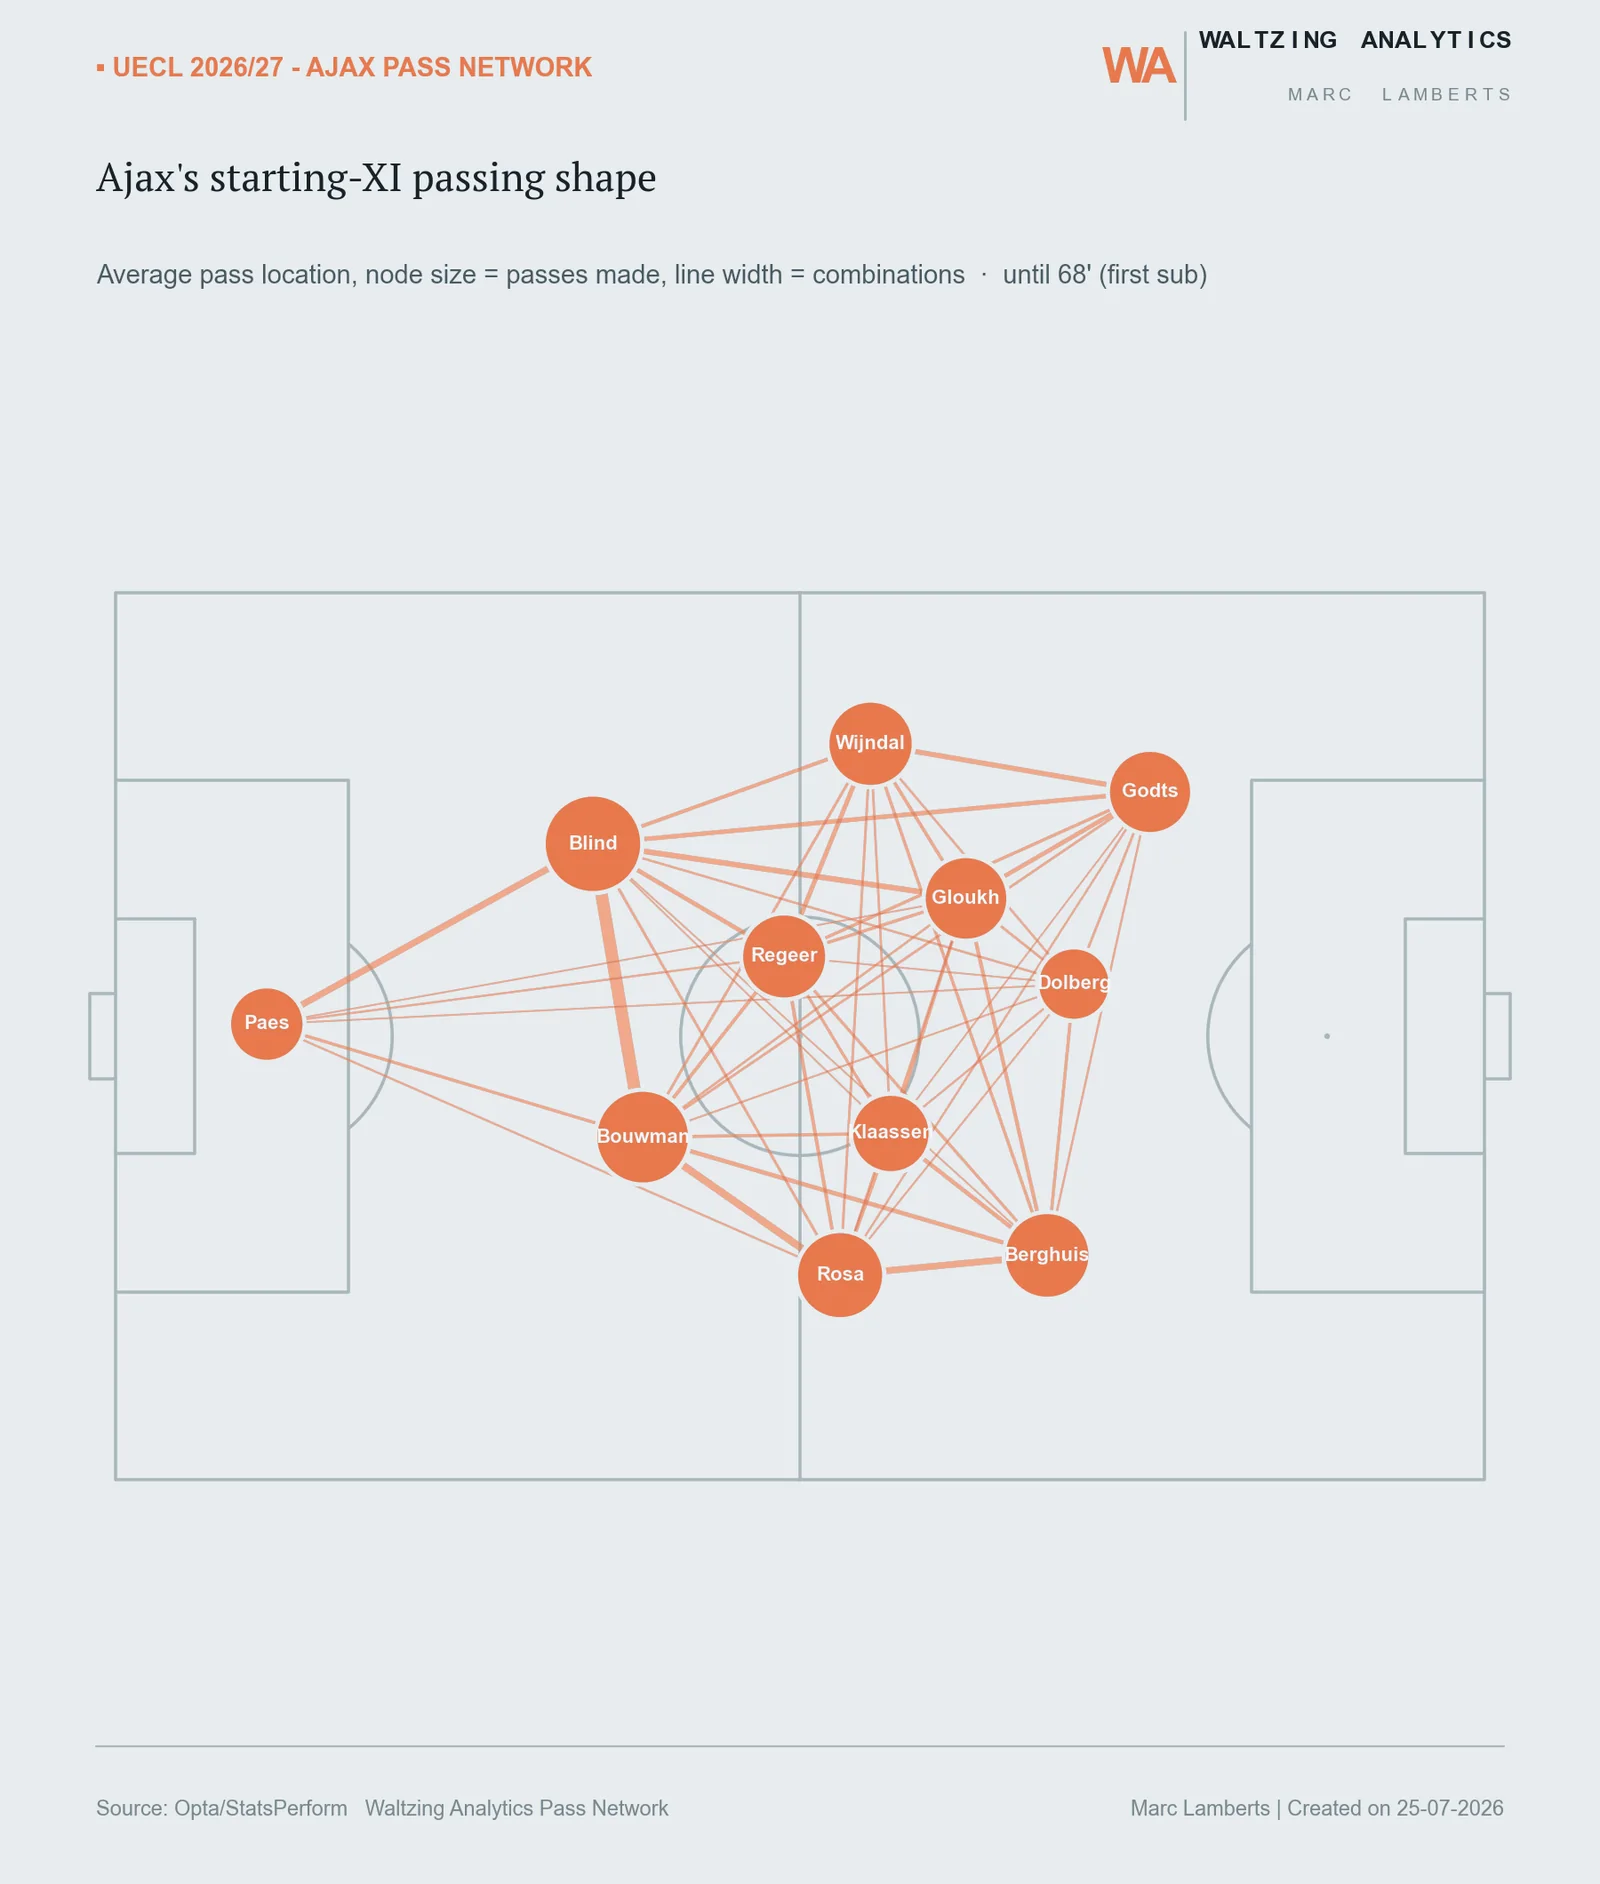
Every shot, sized by xG, stars mark the goals: Vojvodina 1–4 Ajax, 27 shots total.Ajax's xG advantage matched the 1–4 scoreline: cumulative xG by minute, with each goal marked.Ajax generated more than double Vojvodina's threat through open play: cumulative xT from completed passes and take-ons.Ajax's starting-XI passing shape: average pass location, node size = passes made, line width = combinations, until the first substitution.